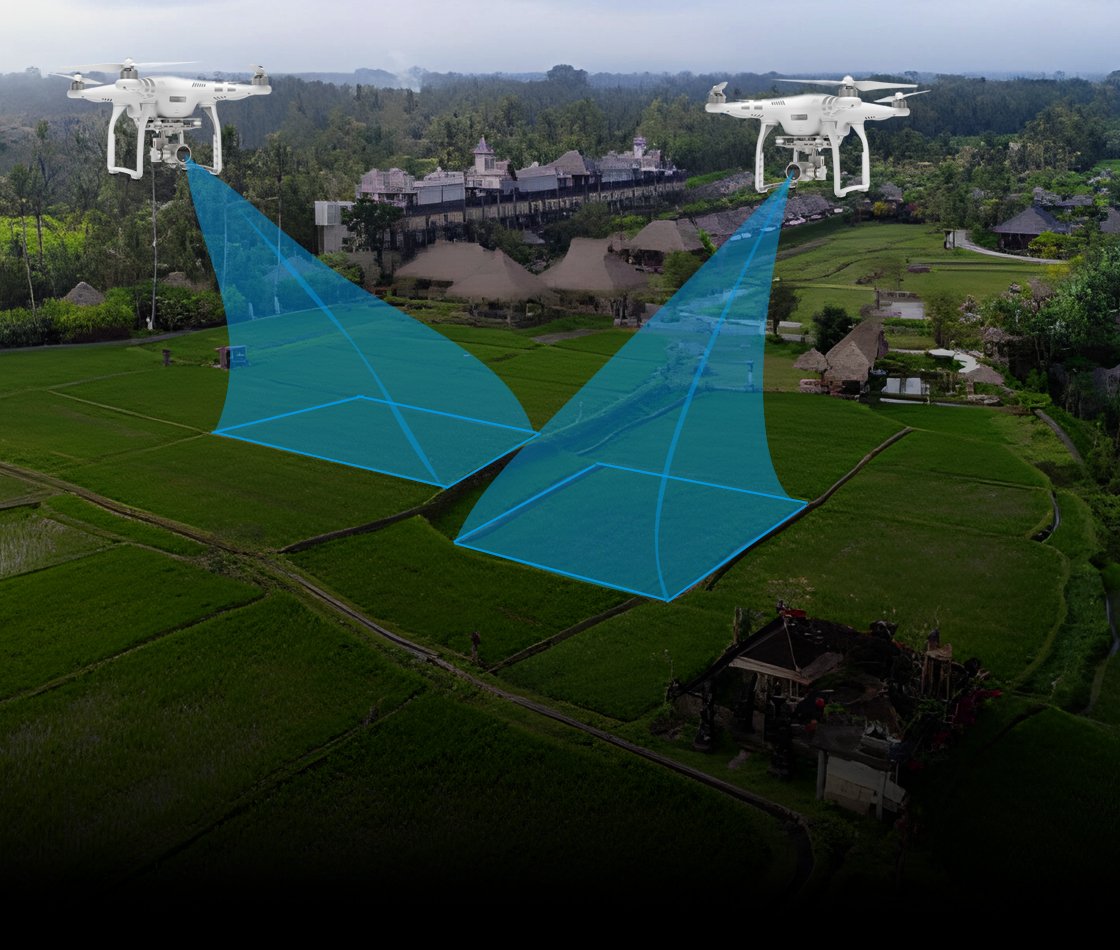
Natural Catastrophe (NAT CAT) Risk Modeling in GIS uses geographical data to assess, visualize, and predict the impact of natural disasters such as floods, earthquakes, hurricanes, or wildfires. By combining geographical data with hazard, exposure, and vulnerability information, GIS enables the identification of high-risk areas, helps in forecasting potential damage, and supports disaster preparedness and response planning. This modeling helps insurance companies, governments, and organizations evaluate risks, make informed decisions, and minimize losses from natural catastrophes.
Models
Our models provide a range of helpful outputs for planning mitigation strategies, developing insurance rates, assessing reinsurance protection plans, and other related tasks.
Expertise
Skylan has expertise in creating quantitative models to calculate possible losses because of man-made and natural hazards. We provide models that are based on historical event, physical hazards processes, exposures, local site circumstances, building and societal features, and historical damages.
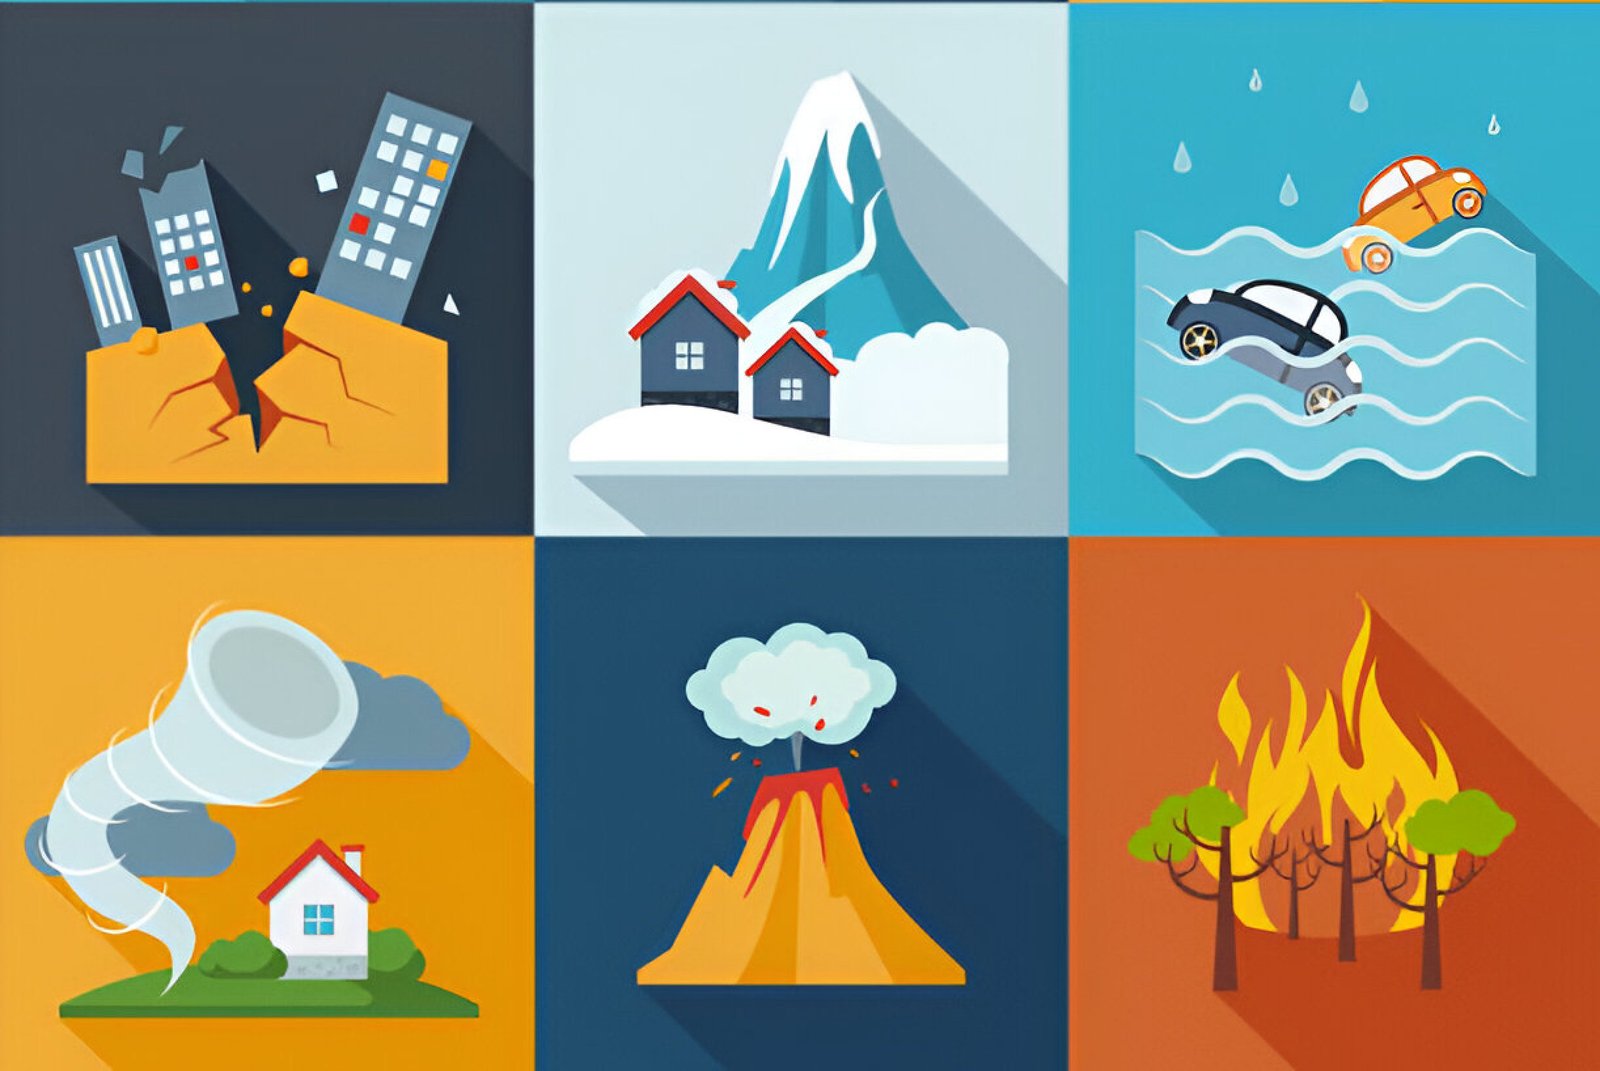
Modeling Hazards
- Cyclone
- Landslides
- Floods
- Weather
- Earthquakes
- Industrial
- Tsunami
- Droughts
- Fire

Developing Exposures
- Population
- Agriculture
- Buildings infrastructure
- Livestock
Understanding Vulnerabilities
- Physical
- Social
- Economic
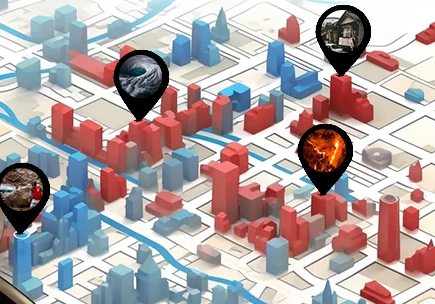
Assessment of Risks
- Event losses
- Average annual loss
- Loss Exceedance curves
- Risk maps
- Loss cost
- Risk profile report
- Mitigation options
- Benefit cost analysis
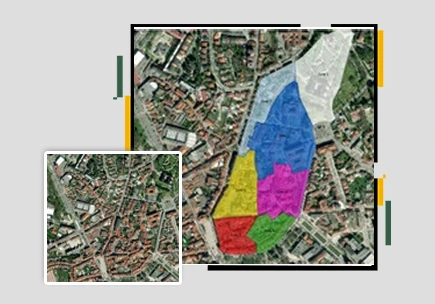
Risk Analytics
SkylanIT provide services like portfolio risk analysis, data mining, which includes temporal and spatial analysis, data cleansing and augmentation, and the creation of specialized analytical tools. Our services help the government, property, and insurance industries in managing the risks and portfolio databases.